Multiple Choice
Figure 19-2
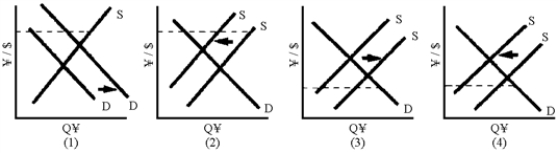
-Of the graphs in Figure 19-2, which one shows Japan practicing "dirty" floating to keep an undervalued currency?
A) 1
B) 2
C) 3
D) 4
Correct Answer:
Verified
Related Questions
Q159: Under the gold standard,
A)no nation had control
Q160: The Bretton Woods agreements
A)established a system of
Q161: Why did the Bretton Woods system ultimately
Q162: To try and stave off a devaluation
Q163: A country with an overvalued currency
A)will have
Unlock this Answer For Free Now!
View this answer and more for free by performing one of the following actions

Scan the QR code to install the App and get 2 free unlocks

Unlock quizzes for free by uploading documents