Figure 11-2
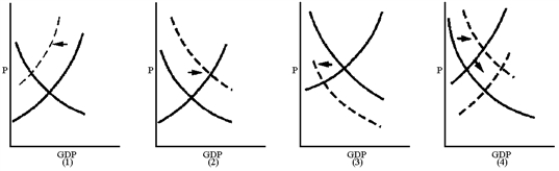
-Which graph in Figure 11-2 best reflects a Keynesian view of the impact of a $500-per-person tax cut?
A) 1
B) 2
C) 3
D) 4
Correct Answer:
Verified
Q163: Figure 11-2 Q164: One objection to supply-side tax cuts is Q165: Figure 11-2 Q166: Critics of supply-side economics argue that Q167: Figure 11-2 Q169: Supply-side tax cuts designed to increase investment Q170: Supply-side tax cuts are more likely to Q171: Capital gains tax cuts inevitably benefit Q172: Figure 11-2 Q173: The primary goal of supply-side economics is Unlock this Answer For Free Now! View this answer and more for free by performing one of the following actions Scan the QR code to install the App and get 2 free unlocks Unlock quizzes for free by uploading documents
![]()
![]()
A)tax cuts
![]()
A)low-income workers.
B)retired
![]()

