Figure 11-3
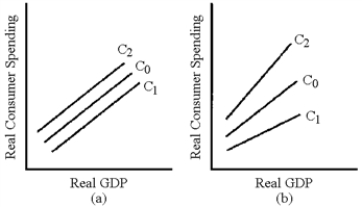
-In Figure 11-3, which line represents the change in the consumption schedule caused by an increase in the personal income tax?
A) C1 in graph (a)
B) C2 in graph (a)
C) C1 in graph (b)
D) C2 in graph (b)
Correct Answer:
Verified
Q178: If the demand-side effects of supply-side tax
Q179: Tax cuts associated with supply-side economics often
Q180: The main idea behind supply-side tax cuts
Q181: Figure 11-3 Q182: As a general rule, when an income Q184: Table 11-1 Q185: Table 11-1 Q186: When government increases a fixed tax, consumption Q187: Table 11-1 Q188: Why does the numerical value of the Unlock this Answer For Free Now! View this answer and more for free by performing one of the following actions Scan the QR code to install the App and get 2 free unlocks Unlock quizzes for free by uploading documents
![]()
![]()
![]()
![]()

