Figure 10-5 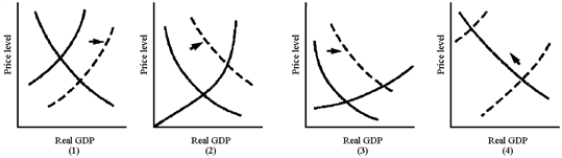
-In Figure 10-5, which graph best illustrates the situation of an economy near full employment that experiences an increase in autonomous consumer spending?
A) (1)
B) (2)
C) (3)
D) (4)
Correct Answer:
Verified
Q194: Self-correcting mechanism reveals that
A)real wages will increase
Q195: Figure 10-6 Q196: During 2008-2010, the U.S.economy showed signs of Q197: Figure 10-5 Q198: Figure 10-6 Q200: Figure 10-6 Q201: What causes the aggregate supply curve to Q202: As the multiplier process is working on Q203: Figure 10-9 Q204: The fact that severe fluctuations in inflation Unlock this Answer For Free Now! View this answer and more for free by performing one of the following actions Scan the QR code to install the App and get 2 free unlocks Unlock quizzes for free by uploading documents
![]()
![]()
![]()
![]()
![]()

