Multiple Choice
Figure 10-6
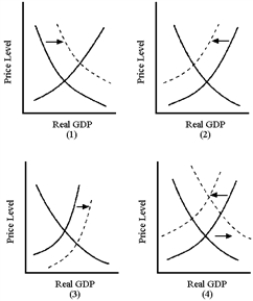
-In Figure 10-6, which graph best illustrates the effect of the beginning of the Iraq war in 2003?
A) (1)
B) (2)
C) (3)
D) (4)
Correct Answer:
Verified
Related Questions
Figure 10-6
-In Figure 10-6, which graph best illustrates the effect of the beginning of the Iraq war in 2003?
A) (1)
B) (2)
C) (3)
D) (4)
Correct Answer:
Verified

