Multiple Choice
Figure 10-6
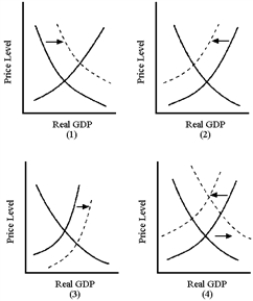
-In Figure 10-6, which graph best illustrates an autonomous increase in consumption spending?
A) (1)
B) (2)
C) (3)
D) (4)
Correct Answer:
Verified
Related Questions
Q195: Figure 10-6 Q196: During 2008-2010, the U.S.economy showed signs of Q197: Figure 10-5 Q198: Figure 10-6 Q199: Figure 10-5 Q201: What causes the aggregate supply curve to Q202: As the multiplier process is working on Q203: Figure 10-9 Q204: The fact that severe fluctuations in inflation Q205: Figure 10-7 Unlock this Answer For Free Now! View this answer and more for free by performing one of the following actions Scan the QR code to install the App and get 2 free unlocks Unlock quizzes for free by uploading documents
![]()
![]()
![]()
![]()
![]()
![]()

