Multiple Choice
Figure 10-7
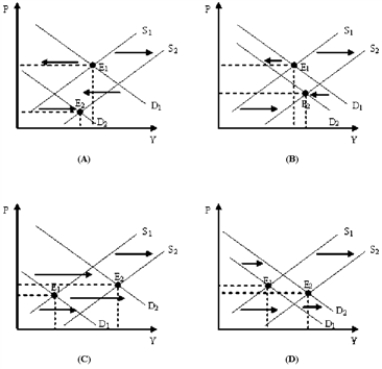
-Refer to Figure 10-7.Which of the diagrams in Figure 10-7 represents a decrease in consumer spending combined with a positive supply shock?
A) Panels (A) & (B)
B) Panels (C) & (D)
C) Panels (A) & (C)
D) Panels (B) & (D)
Correct Answer:
Verified
Related Questions
Q182: How are aggregate supply and stagflation related?
A)Stagflation
Q199: A shift outward of the aggregate supply
Q202: As the multiplier process is working on
Q204: The fact that severe fluctuations in inflation

