Multiple Choice
Figure 10-9
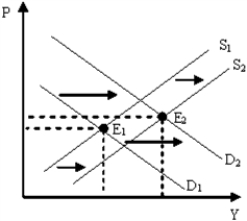
-Figure 10-9 describes which of the following periods in the U.S.?
A) 1930s
B) 1973-1975
C) late 1990s
D) 2007-2009
Correct Answer:
Verified
Related Questions
Q201: What causes the aggregate supply curve to
Q206: The case for government stabilization policy is
Q213: The United States economy in the mid-2000s
Q213: Figure 10-9 Q214: From the mid-1980s until late 2007, many Q214: Figure 10-9 Q215: Figure 10-7 Q216: Distinguish between a movement along the aggregate Q216: Figure 10-7 Q220: Figure 10-8 Unlock this Answer For Free Now! View this answer and more for free by performing one of the following actions Scan the QR code to install the App and get 2 free unlocks Unlock quizzes for free by uploading documents
![]()
![]()
![]()
![]()
![]()

