Figure 4-3
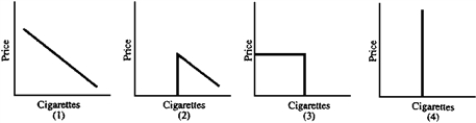
-A 1985 Harvard study showed that the price of cigarettes does not affect how much an individual smokes but whether he smokes.If this is correct, which graph in Figure 4-3 shows the typical individual's demand curve for cigarettes?
A) 1
B) 2
C) 3
D) 4
Correct Answer:
Verified
Q102: The slope of a demand curve is
Q105: Each point on the demand curve is
A)demand
Q105: An individual's demand schedule
A)provides information about what
Q107: The price for labor is the wage
Q108: The price for labor is the wage
Q109: If price rises, what happens to demand
Q110: In an attempt to forecast enrollment, a
Q111: If price rises, what happens to quantity
Q130: Firms often seek to borrow money to
Q366: An important assumption that is made when
Unlock this Answer For Free Now!
View this answer and more for free by performing one of the following actions

Scan the QR code to install the App and get 2 free unlocks

Unlock quizzes for free by uploading documents