Multiple Choice
Figure 4-20
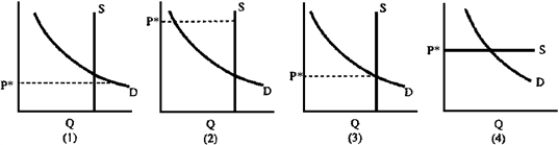
-If there are empty seats at the university basketball game when the price per ticket is P*, then this situation can best be represented by which graph in Figure 4-20?
A) 1
B) 2
C) 3
D) 4
Correct Answer:
Verified
Related Questions
Q216: Figure 4-16 Q217: Figure 4-13 Q218: Studies at Cornell University revealed that chickens Q219: Figure 4-16 Q222: Figure 4-21 Q223: Q223: The _ the demand curve for a Q224: Equilibrium in a market is Q230: Q259: Unlock this Answer For Free Now! View this answer and more for free by performing one of the following actions Scan the QR code to install the App and get 2 free unlocks Unlock quizzes for free by uploading documents
![]()
![]()
![]()
![]()
![]()
A)a situation in![]()
![]()

