Multiple Choice
 Use the figure above to answer the following question
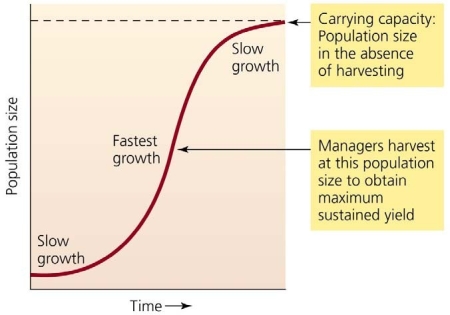
-The arrow at the top right of the graph represents the _______________.
A) point of fastest growth
B) point of slowest growth
C) equilibrium point where births in the population equal deaths
D) point of maximum sustainable yield
E) extinction point
Correct Answer:
Verified
Related Questions
Q12: Choose the item best matches each item
Q13: Deforestation _.
A) causes population explosions
B) has the
Q14: Fire history in an open pine woodland
Unlock this Answer For Free Now!
View this answer and more for free by performing one of the following actions

Scan the QR code to install the App and get 2 free unlocks

Unlock quizzes for free by uploading documents