 Use the figure above to answer the following question.
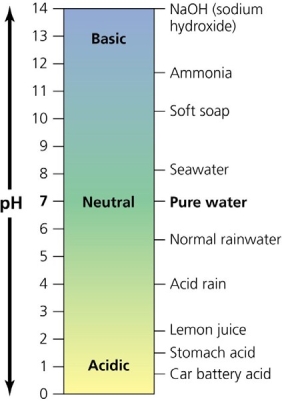
-The figure suggests that the biological pH values displayed in the graph (are) ________________
A) indicate an absence of hydrogen ions
B) in the extremely acid range
C) range from 1.5 to 8
D) indicate an absence of hydroxide ions
E) in the extremely alkaline range
Correct Answer:
Verified
Q6: Q7: _ is defined as the number of Q8: Q9: Choose the item that best matches each Q10: Geographic Information Systems (GIS) is _ Q12: Compared to energy-flow in ecosystems, the flow Q13: Choose the item that best matches each Q14: The greatest source of both nitrogen and Q15: Which of the following represents an example Q16: Choose the item that best matches each![]()
![]()
A) useful
Unlock this Answer For Free Now!
View this answer and more for free by performing one of the following actions

Scan the QR code to install the App and get 2 free unlocks

Unlock quizzes for free by uploading documents