Multiple Choice
 Use the figure above to answer the following question
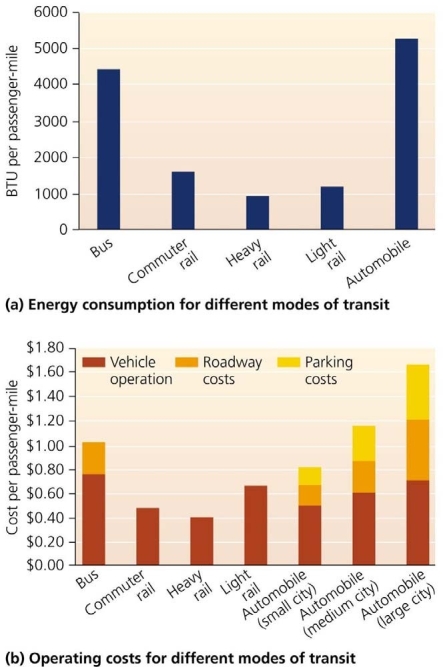
-According to the graphs, the energy consumption per passenger mile __________
A) is more than twice as high for automobiles as it is for any other form of transportation
B) continues to increase for all types of transit
C) is only half as high for bus riders as it is for people in cars
D) is higher for all types of road use than it is for rail use
E) rises as you get farther from the city center
Correct Answer:
Verified
Related Questions
Unlock this Answer For Free Now!
View this answer and more for free by performing one of the following actions

Scan the QR code to install the App and get 2 free unlocks

Unlock quizzes for free by uploading documents