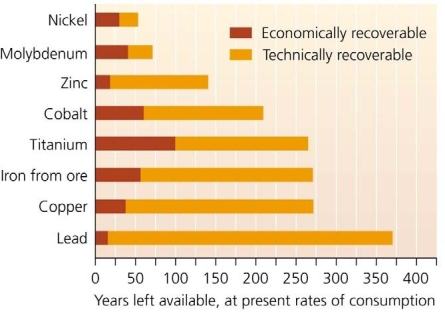
 Use the figure above to answer the following question
-This bar graph tells us that _______________.
A) if consumption rates on all metals rise, the price should come down
B) using current technology, the prices of lead and zinc will decline in the next century
C) metals are renewable resources
D) at current rates of consumption, most metals will become scarcer and costlier
E) all the metals will be available at current prices for between 100-400 years
Correct Answer:
Verified
Q9: Tantalum from African coltan is used primarily
Q10: A naturally occurring solid chemical element with
Q11: Choose the item that best matches each
Q12: Choose the item that best matches each
Q13: Q15: Most metals, such as iron and copper, Q16: Choose the item that best matches each Q17: If a mineral is opaque, lustrous, malleable,![]()
Unlock this Answer For Free Now!
View this answer and more for free by performing one of the following actions

Scan the QR code to install the App and get 2 free unlocks

Unlock quizzes for free by uploading documents