The graph indicates that since 1960, global average temperatures have: 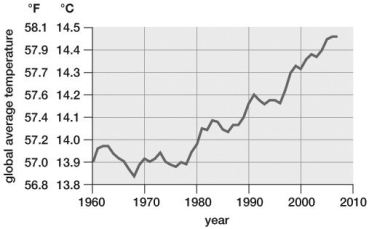
A) remained constant.
B) only decreased.
C) only increased.
D) fluctuated but risen overall.
E) initially increased but are now dropping.
Correct Answer:
Verified
Q102: Plants produce biomass by taking in energy,
Q106: What would happen if there were no
Q107: On a field trip with your class
Q115: Why is phosphorus so important to living
Q117: A rancher begins raising sheep on the
Q119: According to the data presented in the
Q119: Sulfur dioxide is a natural product of
Q121: This graph, based on IPCC estimates, predicts
Q122: In an attempt to become more environmentally
Q123: As part of a research project, a
Unlock this Answer For Free Now!
View this answer and more for free by performing one of the following actions

Scan the QR code to install the App and get 2 free unlocks

Unlock quizzes for free by uploading documents