Multiple Choice
The population shown in the graph is demonstrating: 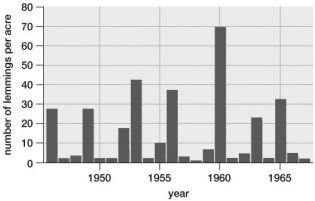
A) a typical boom-and-bust pattern.
B) clumped distribution.
C) an S-curve growth pattern.
D) exponential growth.
E) logistic population growth.
Correct Answer:
Verified
Related Questions
Q81: Why has it been so hard to
Q86: Which tends to be more intense: intraspecific
Q101: The population shown in the pyramid is:
Q102: Which population represented on the graph has
Q103: Zebra mussels were introduced into Lake St.
Unlock this Answer For Free Now!
View this answer and more for free by performing one of the following actions

Scan the QR code to install the App and get 2 free unlocks

Unlock quizzes for free by uploading documents