Use the figure for the question(s) below.Consider the following graph of the security market line: 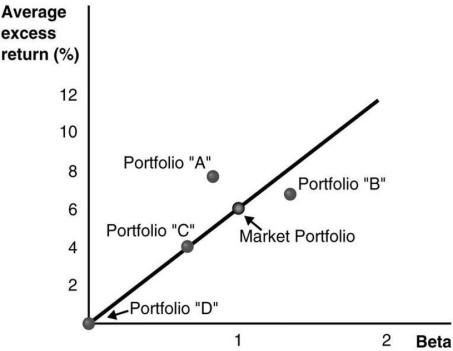
-Portfolio "A":
A) has a relatively lower expected return than predicted.
B) has a positive alpha.
C) falls below the SML.
D) is overpriced.
Correct Answer:
Verified
Q28: Use the following information to answer the
Q29: Use the following information to answer the
Q30: Use the following information to answer the
Q31: A stock's _ measures the stock's return
Q32: Which of the following statements is FALSE?
A)A
Q34: Use the figure for the question(s)below.Consider the
Q35: Use the following information to answer the
Q36: Which of the following statements is FALSE?
A)If
Q37: Use the following information to answer the
Q38: Use the following information to answer the
Unlock this Answer For Free Now!
View this answer and more for free by performing one of the following actions

Scan the QR code to install the App and get 2 free unlocks

Unlock quizzes for free by uploading documents