According to the following graphic, X and Y have _________. 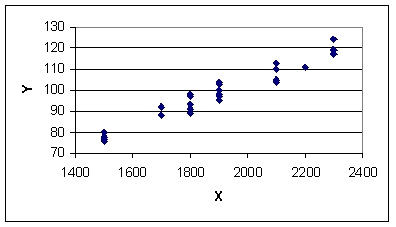
A) strong negative correlation
B) virtually no correlation
C) strong positive correlation
D) moderate negative correlation
E) weak negative correlation
Correct Answer:
Verified
Q25: Prediction intervals get narrower as we extrapolate
Q26: According to the following graphic, X and
Q27: Given x, a 95% prediction interval for
Q28: A t-test is used to determine whether
Q29: From the following scatter plot, we can
Q31: Regression output from Excel software includes an
Q32: A confidence interval based on a specific
Q33: From the following scatter plot, we can
Q34: The range of admissible values for the
Q35: From the following scatter plot, we can
Unlock this Answer For Free Now!
View this answer and more for free by performing one of the following actions

Scan the QR code to install the App and get 2 free unlocks

Unlock quizzes for free by uploading documents