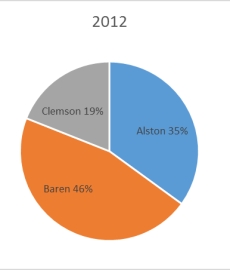
The 2010 and 2012 market share data of three competitors (Alston, Baren, and Clemson) in an oligopolistic industry are presented in the following pie charts.Total sales for this industry were $1.5 billion in 2010 and $1.8 billion in 2012.Baren's sales in 2010 were ___________. 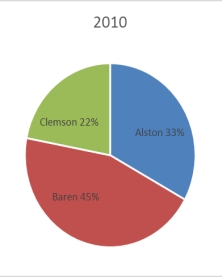
A) $342 million
B) $630 million
C) $675 million
D) $828 million
E) $928 million
Correct Answer:
Verified
Q60: Consider the following frequency distribution:
Q61: An instructor has decided to graphically represent
Q62: The staff of Mr.Wayne Wertz, VP of
Q63: The 2010 and 2012 market share data
Q64: The following is a bar chart of
Q66: Each day, the office staff at Oasis
Q67: Each day, the office staff at Oasis
Q68: Each day, the manager at Jamie's Auto
Q69: The staff of Mr.Wayne Wertz, VP of
Q70: The 2010 and 2012 market share data
Unlock this Answer For Free Now!
View this answer and more for free by performing one of the following actions

Scan the QR code to install the App and get 2 free unlocks

Unlock quizzes for free by uploading documents