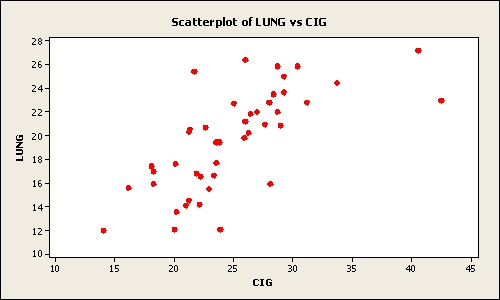
The following graphic of cigarettes smoked (sold) per capita (CIG) and deaths per 100K population from lung cancer (LUNG) indicates _________ 
A) a weak negative relationship between the two variables
B) a somewhat positive relationship between the two variables
C) when the number of cigarettes smoked (sold) per capita (CIG) increases the deaths per 100K population from lung cancer (LUNG) decreases
D) a negative relationship between the two variables
E) no relationship between the two variables
Correct Answer:
Verified
Q79: Each day, the office staff at Oasis
Q80: The staff of Mr.Wayne Wertz, VP of
Q81: Your company is doing market research to
Q82: Given two class intervals and their respective
Q83: If both variables being analyzed are nominal
Q85: Your company is doing market research to
Q86: According to the following graphic, "Bent Pins"
Q87: The customer help center in your company
Q88: In a frequency distribution, the first class
Q89: The following pie chart shows the market
Unlock this Answer For Free Now!
View this answer and more for free by performing one of the following actions

Scan the QR code to install the App and get 2 free unlocks

Unlock quizzes for free by uploading documents