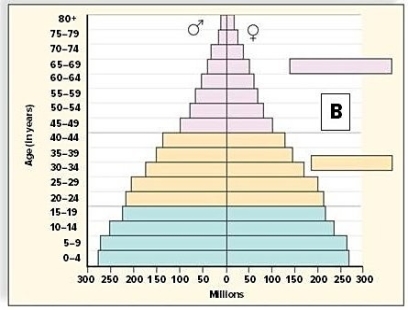
Which of these diagrams represents an age structure diagram of more-developed countries? 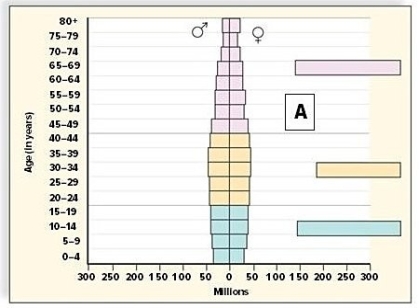
A) Diagram A
B) Diagram B
Correct Answer:
Verified
Q21: Which of the following circumstances would cause
Q22: A(n)_ consists of all the populations of
Q23: From the perspective of population growth,what three
Q24: Only the LDCs will be experiencing overpopulation
Q25: Farmers sprayed litchi trees to suppress populations
Q27: The sequence of decreased death rate followed
Q28: Many species are held below the environmental
Q29: A population in which death rates are
Q30: Most species are intermediate between r-strategists and
Q31: Which of the following lifestyle changes would
Unlock this Answer For Free Now!
View this answer and more for free by performing one of the following actions

Scan the QR code to install the App and get 2 free unlocks

Unlock quizzes for free by uploading documents