The graph pictured below depicts blood glucose changes after eating a meal.The pink line,drawn with square symbols,represents normal variations in glucose levels after a meal.The black line,drawn with diamond symbols,represents levels seen in diabetes mellitus.Differentiate between the normal and abnormal blood glucose levels after a meal and briefly explain the reason for the abnormality. 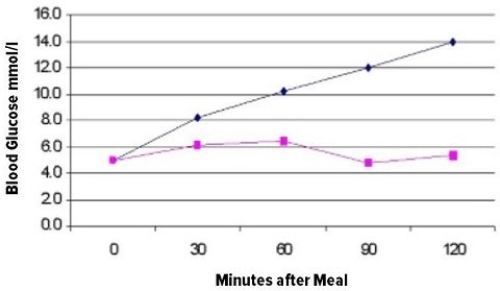
Correct Answer:
Verified
View Answer
Unlock this answer now
Get Access to more Verified Answers free of charge
Q26: The birth of a baby and milk
Q27: How are hormone levels regulated?
A)An endocrine gland
Q28: What is the cascade of events that
Q29: The effects of hyposecretion and hypersecretion of
Q30: Which of the following statements about parathyroid
Q32: Which is an example of negative feedback?
A)Nursing
Q33: Which of the following is NOT a
Q34: What gland,located in the brain,produces melatonin?
A)pancreas
B)pineal gland
C)adrenal
Q35: The oversecretion of _ by the thyroid
Q36: Identify the hormone that is released by
Unlock this Answer For Free Now!
View this answer and more for free by performing one of the following actions

Scan the QR code to install the App and get 2 free unlocks

Unlock quizzes for free by uploading documents