Refer to the information provided in Figure 5.7 below to answer the question(s) that follow. 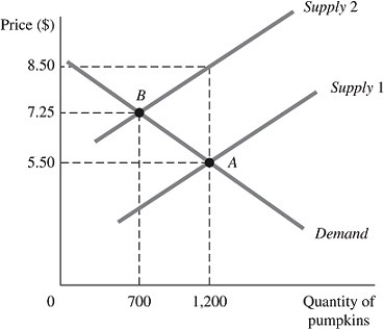 Figure 5.7
The above figure represents the market for pumpkins both before and after the imposition of an excise tax, which is represented by the shift of the supply curve.
-Refer to Figure 5.7. After the tax, store owners are willing to sell ________ pumpkins at a price of ________ each.
A) 1,200; $5.50
B) 700; $7.25
C) 0; $8.50
D) 1,200; $7.25
Correct Answer:
Verified
Q175: Refer to the information provided in Figure
Q176: Refer to the information provided in Figure
Q177: Which of the following, if true, would
Q178: Refer to the information provided in Figure
Q179: It is possible that an increase in
Q181: In order to discourage consumers from consuming
Q182: A tax on a good whose demand
Q183: The more _ the demand is for
Q184: A government is considering levying an alcohol
Q185: If government officials are mainly interested in
Unlock this Answer For Free Now!
View this answer and more for free by performing one of the following actions

Scan the QR code to install the App and get 2 free unlocks

Unlock quizzes for free by uploading documents