Refer to the information provided in Figure 5.7 below to answer the question(s) that follow. 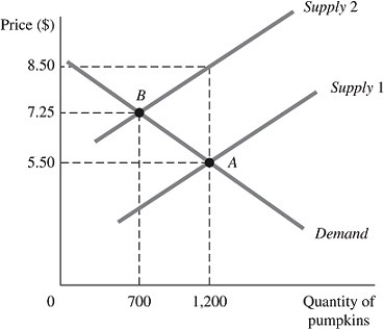 Figure 5.7
The above figure represents the market for pumpkins both before and after the imposition of an excise tax, which is represented by the shift of the supply curve.
-Refer to Figure 5.7. Had the demand for pumpkins been perfectly inelastic at Point A, the amount customers would have paid per pumpkin after the imposition of this tax would have been
A) $0.
B) $5.50.
C) $7.25.
D) $8.50.
Correct Answer:
Verified
Q164: Refer to the information provided in Figure
Q165: Refer to the information provided in Figure
Q166: Refer to the information provided in Figure
Q167: If a group has a positive elasticity
Q168: Refer to the information provided in Figure
Q170: Which of the following, if true, would
Q171: Normal goods will experience decreasing demand when
Q172: Refer to the information provided in Figure
Q173: A negative income elasticity implies that the
Q174: Refer to the information provided in Figure
Unlock this Answer For Free Now!
View this answer and more for free by performing one of the following actions

Scan the QR code to install the App and get 2 free unlocks

Unlock quizzes for free by uploading documents