Refer to the information provided in Figure 13.1 below to answer the question that follows. 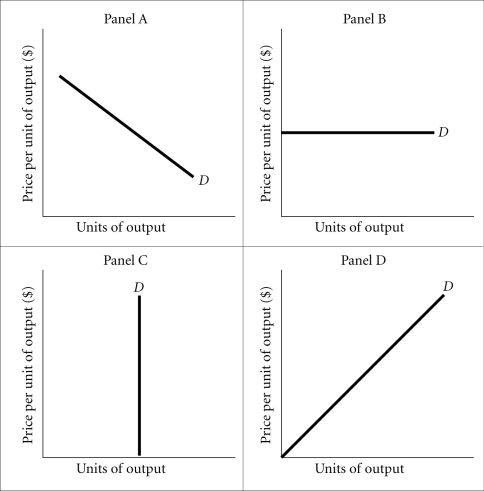 Figure 13.1
-Refer to Figure 13.1. Of the following choices, Panel A best represents the demand curve for
A) an individual producer of soybeans.
B) Dell computers.
C) insulin.
D) all of the above
Correct Answer:
Verified
Q16: In imperfectly competitive markets
A) there is no
Q17: Market power refers to a firm's ability
Q18: The _ broadly a market is defined,
Q19: Imperfect competition and market power
A) are major
Q20: In an imperfectly competitive industry
A) a single
Q22: Firms with market power must decide all
Q23: Refer to the information provided in Figure
Q24: _ is an industry market structure with
Q25: The demand for shoes will likely be
Q26: All of the following industry types have
Unlock this Answer For Free Now!
View this answer and more for free by performing one of the following actions

Scan the QR code to install the App and get 2 free unlocks

Unlock quizzes for free by uploading documents