Refer to the information provided in Figure 12.2 below to answer the question(s) that follow. 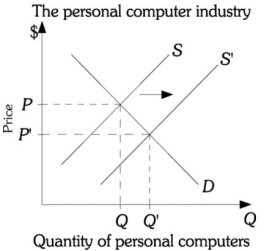 Figure 12.2
-Refer to Figure 12.2. The graph of this situation represents a partial equilibrium analysis because it
A) only shows a change in supply.
B) considers only the personal computer industry.
C) shows changes to both price and quantity.
D) only shows two possible equilibrium points.
Correct Answer:
Verified
Q14: Examining the equilibrium conditions of individual markets
Q15: A technological change in the production of
Q16: Initially the beef and mutton markets are
Q17: Suppose there is a permanent shift of
Q18: Resources are allocated efficiently when
A) the market
Q20: Refer to the information provided in Figure
Q21: Refer to the information provided in Figure
Q22: _ occurs when the economy is producing
Q23: Partial equilibrium analysis refers to _ examining
Q24: Refer to the information provided in Figure
Unlock this Answer For Free Now!
View this answer and more for free by performing one of the following actions

Scan the QR code to install the App and get 2 free unlocks

Unlock quizzes for free by uploading documents