Refer to the information provided in Figure 1.5 below to answer the question(s) that follow. 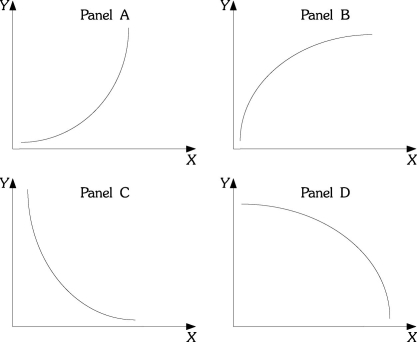 Figure 1.5
-Refer to Figure 1.5. As income increases, consumption increases, but for each additional increase in income, consumption increases by a larger and larger amount. If consumption is graphed on the vertical axis and income is graphed on the horizontal axis, the relationship between consumption and income would look like which of the following Panels?
A) A
B) B
C) C
D) D
Correct Answer:
Verified
Q209: Refer to the information provided in Figure
Q210: Refer to the information provided in Figure
Q211: The slope of a vertical line is
A)
Q212: Refer to the information provided in Figure
Q213: Refer to the information provided in Figure
Q215: If the slope of a straight line
Q216: Refer to the information provided in Figure
Q217: Refer to the information provided in Figure
Q218: The slope of a non-linear curve
A) is
Q219: Refer to the information provided in Figure
Unlock this Answer For Free Now!
View this answer and more for free by performing one of the following actions

Scan the QR code to install the App and get 2 free unlocks

Unlock quizzes for free by uploading documents