Using the following diagram, demonstrate graphically and explain verbally why Q0 is not a profit maximizing output level. 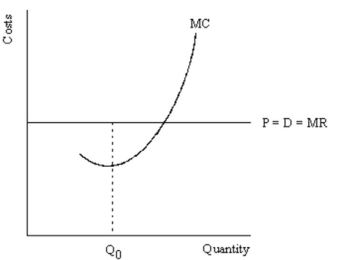
Correct Answer:
Verified
View Answer
Unlock this answer now
Get Access to more Verified Answers free of charge
Q18: Describe how a market supply curve relates
Q19: You are running a business in a
Q20: Define a perfectly competitive market, and list
Q21: Consider the following table of numbers,
Q22: Using a supply and demand and a
Q24: Consider the following table of numbers,
Q25: Using the following diagram, demonstrate that producing
Q26: Consider the following table of numbers,
Q27: Consider the following diagram: Q28: Study the graph below and answer the![]()
Unlock this Answer For Free Now!
View this answer and more for free by performing one of the following actions

Scan the QR code to install the App and get 2 free unlocks

Unlock quizzes for free by uploading documents