The diagram below represents the producer side of the market for skateboards in New York. The current price of skateboards is PA. Each of the events described below will have some impact on the supply of skateboards. For each event, draw a picture to illustrate the effect of the event. Be sure to explain your pictures using pertinent economic terminology ("movement along" or "change in quantity"). 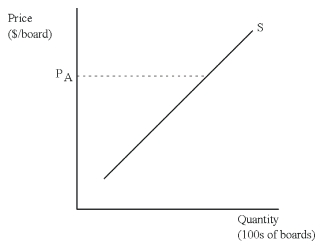 (a) A drop in the price of skateboards.
(b) An increase in the price of wheels used in the manufacturing of skateboards.
Correct Answer:
Verified
View Answer
Unlock this answer now
Get Access to more Verified Answers free of charge
Q6: What are normal goods? What are inferior
Q7: Consider the following supply table, which
Q8: Demonstrate graphically and explain the difference between
Q9: The diagram below represents the consumer side
Q10: In one year, the price of soybeans
Q12: Demonstrate graphically and explain the difference between
Q13: Explain the following statement: "The invisible hand
Q14: Use examples to demonstrate why the ability
Q15: How is the "Law of Demand" different
Q16: What is meant by "the fallacy of
Unlock this Answer For Free Now!
View this answer and more for free by performing one of the following actions

Scan the QR code to install the App and get 2 free unlocks

Unlock quizzes for free by uploading documents