Refer to the graphs shown, which show indifference curve analysis with the associated demand curves. 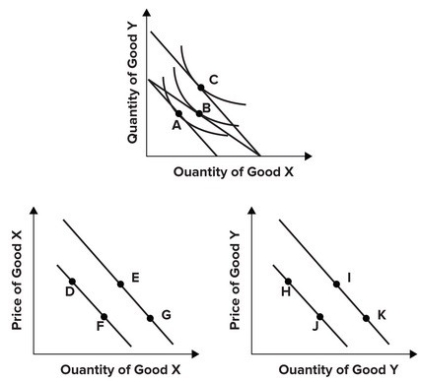 The effect of a decrease in the price of X is shown by the movements from:
A) A to B, D to E, or F to G.
B) A to B, D to F, or E to G.
C) B to C, D to F, or E to G.
D) B to C, D to E, or F to G.
Correct Answer:
Verified
Q118: Joseph Gallo poured two glasses of wine
Q119: Refer to the graph shown. Which price
Q120: As a consumer moves along a budget
Q121: Refer to the graphs shown, which show
Q122: Using the indifference curve model, a demand
Q124: Using indifference curve analysis, you can identify
Q125: Refer to the graphs shown. 
Q126: Refer to the graphs shown, which show
Q127: Refer to the graph shown.
Q128: Refer to the graph shown.
Unlock this Answer For Free Now!
View this answer and more for free by performing one of the following actions

Scan the QR code to install the App and get 2 free unlocks

Unlock quizzes for free by uploading documents