Refer to the graph shown. If this graph represents a monopoly market, the equilibrium price and quantity will be: 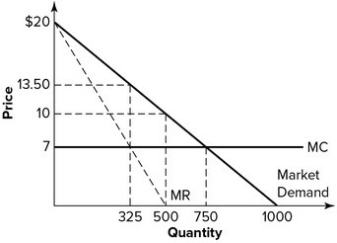
A) $13.50 and 325, respectively.
B) $7 and 325, respectively.
C) $10 and 500, respectively.
D) $7 and 750, respectively.
Correct Answer:
Verified
Q221: If P = Q/15 represents market supply
Q222: Suppose marginal cost is constant and equal
Q223: Refer to the graph shown. The welfare
Q224: Refer to the graph shown. If this
Q225: If P = Q/15 represents marginal cost
Q226: If MC = Q/15 represents marginal cost
Q227: If MC = Q/15 represents marginal cost
Q228: Refer to the graph shown. If this
Q230: If P = Q/15 represents market supply
Q231: If MC = Q/15 represents marginal cost
Unlock this Answer For Free Now!
View this answer and more for free by performing one of the following actions

Scan the QR code to install the App and get 2 free unlocks

Unlock quizzes for free by uploading documents