Refer to the graph shown depicting a perfectly competitive firm. If average variable cost is $3 at quantity 450, points A through E represent the: 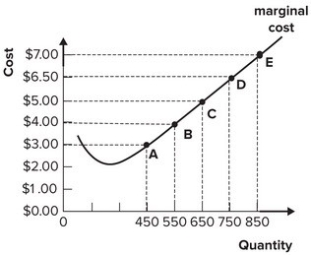
A) firm's total cost curve.
B) firm's total revenue curve.
C) demand for the firm's product.
D) firm's supply curve.
Correct Answer:
Verified
Q41: Refer to the graph shown. What area
Q42: Refer to the graph shown. What distance
Q43: Refer to the graph shown. If market
Q44: Refer to the table shown. If
Q45: Refer to the table shown. If
Q47: Refer to the graph shown. If market
Q48: Refer to the graph shown. What level
Q49: Refer to the graph shown. A perfectly
Q50: Refer to the table shown. The
Q51: Refer to the graph shown. If market
Unlock this Answer For Free Now!
View this answer and more for free by performing one of the following actions

Scan the QR code to install the App and get 2 free unlocks

Unlock quizzes for free by uploading documents