Refer to the graph shown. The output range in region b is associated with: 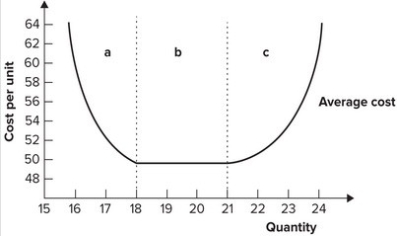
A) diminishing marginal productivity.
B) constant returns to scale.
C) economies of scale.
D) diseconomies of scale.
Correct Answer:
Verified
Q54: The long-run average cost of producing 12
Q55: The graph shown exhibits diseconomies of scale:
Q56: The upward-sloping part of the long-run average
Q57: Refer to the graph shown. If the
Q58: At the minimum efficient level of production:
A)
Q60: Diseconomies of scale are associated with:
A) decreasing
Q61: Which of the following provides the best
Q62: Which of the following is most likely
Q63: Refer to the graph shown. If a
Q64: Refer to the graph shown. A firm
Unlock this Answer For Free Now!
View this answer and more for free by performing one of the following actions

Scan the QR code to install the App and get 2 free unlocks

Unlock quizzes for free by uploading documents