Refer to the graph shown. A firm that produces 900 units of output using the plant size associated with SATC2 minimizes: 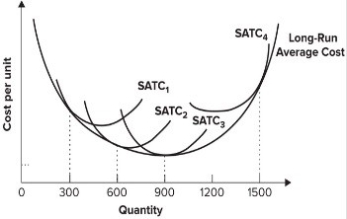
A) both long-run and short-run average total cost.
B) long-run average total cost only.
C) short-run average total cost only.
D) neither long-run nor short-run average total cost.
Correct Answer:
Verified
Q67: The short-run average total cost curve is
Q68: Long-run average costs at any output level
Q69: The upward-sloping portion of the short-run average
Q70: The upward-sloping portion of the long-run average
Q71: In the long run:
A) all inputs are
Q73: Which of the following is an accurate
Q74: Refer to the graph shown. If a
Q75: Refer to the graph shown. If the
Q76: Refer to the graph shown. If a
Q77: A firm's average cost increases as it
Unlock this Answer For Free Now!
View this answer and more for free by performing one of the following actions

Scan the QR code to install the App and get 2 free unlocks

Unlock quizzes for free by uploading documents