Refer to the graph shown. The least-cost method of producing 1,000 units of output is shown at point: 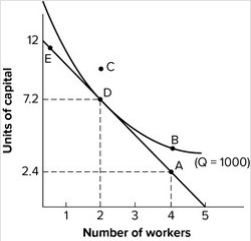
A) A.
B) B.
C) C.
D) D.
Correct Answer:
Verified
Q117: An isoquant is a curve that represents
Q118: As you move down an isoquant:
A) more
Q119: If labor costs $10 per unit and
Q120: The marginal rate of substitution of an
Q121: Refer to the graph shown. If the
Q123: Refer to the graph shown. If the
Q124: Refer to the graph shown. If the
Q125: Refer to the graph shown. The marginal
Q126: Refer to the graph shown. The most
Q127: Refer to the graph shown. The cheapest
Unlock this Answer For Free Now!
View this answer and more for free by performing one of the following actions

Scan the QR code to install the App and get 2 free unlocks

Unlock quizzes for free by uploading documents