Refer to the following graph. 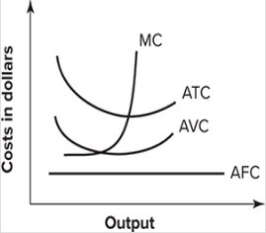 This set of cost curves is:
A) correct.
B) wrong because the average total cost and the marginal cost curves are reversed.
C) wrong because the average fixed cost curve is drawn incorrectly.
D) wrong because the average fixed cost curve is shown to be below the average variable cost.
Correct Answer:
Verified
Q134: The U shape of the average total
Q135: Refer to the graph shown. The line
Q136: Other things being equal, when average productivity
Q137: The following graph shows average fixed costs,
Q138: The following graph shows average fixed costs,
Q140: Refer to the following graph. 
Q141: Refer to the following graph.
Q142: If marginal cost exceeds average total cost:
A)
Q143: The minimum point of the average total
Q144: The marginal cost curve is a mirror
Unlock this Answer For Free Now!
View this answer and more for free by performing one of the following actions

Scan the QR code to install the App and get 2 free unlocks

Unlock quizzes for free by uploading documents