Refer to the graph shown. Total fixed cost of producing Q* is represented by: 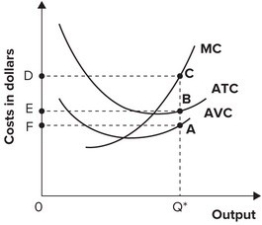
A) area 0Q*AF.
B) area ABEF.
C) area ACDF.
D) cannot be determined.
Correct Answer:
Verified
Q127: Refer to the graph shown. The line
Q128: Refer to the following graph. 
Q129: The marginal cost curve:
A) first rises and
Q130: Refer to the graph shown. Total cost
Q131: The typical average variable cost curve:
A) is
Q133: Refer to the following graph.
Q134: The U shape of the average total
Q135: Refer to the graph shown. The line
Q136: Other things being equal, when average productivity
Q137: The following graph shows average fixed costs,
Unlock this Answer For Free Now!
View this answer and more for free by performing one of the following actions

Scan the QR code to install the App and get 2 free unlocks

Unlock quizzes for free by uploading documents