Refer to the following graph. 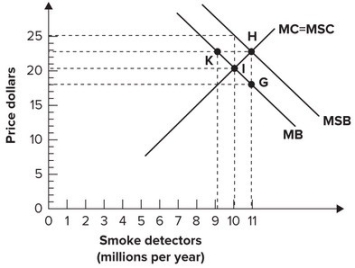 The point on the graph corresponding to the socially optimal output per year and the price sellers must receive to make that amount available is shown by point:
A) G.
B) H.
C) I.
D) K.
Correct Answer:
Verified
Q44: Refer to the graph shown, which shows
Q45: Refer to the graph shown. There is
Q46: Refer to the following graph. 
Q47: Suppose that government wants a policy that
Q48: If once vaccinated, a person cannot catch
Q50: If a negative externality exists in the
Q51: Refer to the graph shown. There is
Q52: Refer to the graph shown, which shows
Q53: Refer to the graph shown. Assuming a
Q54: If a corrective tax on gasoline results
Unlock this Answer For Free Now!
View this answer and more for free by performing one of the following actions

Scan the QR code to install the App and get 2 free unlocks

Unlock quizzes for free by uploading documents