Refer to the graph shown. In equilibrium, consumer surplus is equal to: 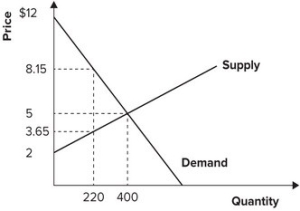
A) 600.
B) 1,200.
C) 1,400.
D) 2,000.
Correct Answer:
Verified
Q8: Refer to the graph shown. The market
Q9: A price ceiling is, in essence, an
Q10: Total producer surplus is measured as the
Q11: When the market is in equilibrium, total
Q12: If the government's goal is to alter
Q14: The military draft can be seen as
Q15: The more inelastic the demand for agricultural
Q16: The distance between the supply curve and
Q17: Refer to the graph shown. In equilibrium,
Q18: If the demand for Insulin is highly
Unlock this Answer For Free Now!
View this answer and more for free by performing one of the following actions

Scan the QR code to install the App and get 2 free unlocks

Unlock quizzes for free by uploading documents