Refer to the graph shown. If the price of this product fell from $5.00 to $2.50 (because of a price ceiling or a shift in demand) , producer surplus would fall from: 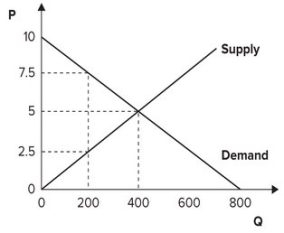
A) 2,000 to 500.
B) 1,000 to 500.
C) 1,000 to 250.
D) 500 to 250.
Correct Answer:
Verified
Q16: The distance between the supply curve and
Q17: Refer to the graph shown. In equilibrium,
Q18: If the demand for Insulin is highly
Q19: Total consumer surplus is measured as the
Q20: If a tax is legally required to
Q22: Refer to the graph shown. If consumers
Q23: Refer to the graph shown. When the
Q24: Refer to the graph shown. When the
Q25: Refer to the graph shown. When the
Q26: Refer to the graph shown. The difference
Unlock this Answer For Free Now!
View this answer and more for free by performing one of the following actions

Scan the QR code to install the App and get 2 free unlocks

Unlock quizzes for free by uploading documents