Refer to the graph shown. Assume the market is initially in equilibrium at point b in the graph but the imposition of a per-unit tax on this product shifts the supply curve up from S0 to S1. The welfare loss triangle from this tax is represented by area: 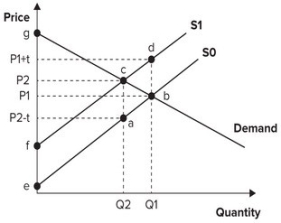
A) cfg.
B) beg.
C) abc.
D) abdc.
Correct Answer:
Verified
Q54: Graphically, deadweight loss is shown by the:
A)
Q55: When government imposes a per-unit tax on
Q56: Refer to the graph shown. Assume that
Q57: Refer to the graph shown. Assume that
Q58: Refer to the graph shown. Assume that
Q60: Refer to the graph shown. Assume the
Q61: Refer to the graph shown. Assume that
Q62: Refer to the graph shown. Initial market
Q63: Refer to the graph shown. Initially, the
Q64: Refer to the graph shown. Initially, the
Unlock this Answer For Free Now!
View this answer and more for free by performing one of the following actions

Scan the QR code to install the App and get 2 free unlocks

Unlock quizzes for free by uploading documents