Refer to the graphs shown. The most tax revenue collected by a given per-unit tax on producers is shown by graphs: 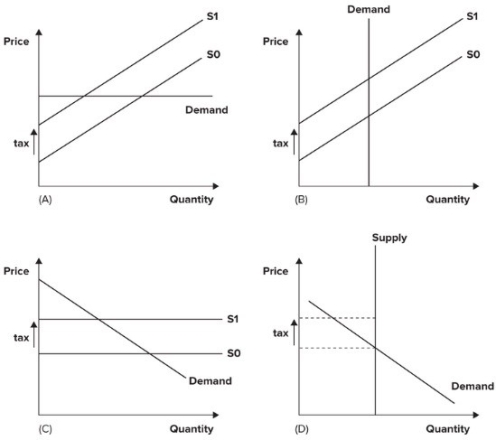
A) A and D.
B) B and C.
C) C and D.
D) B and D.
Correct Answer:
Verified
Q95: Refer to the graph shown. Given the
Q96: Given the same price elasticity of supply,
Q97: If elasticity of demand is 0.7, elasticity
Q98: Refer to the graphs shown. Deadweight loss
Q99: Refer to the graphs shown. In which
Q101: Refer to the graph shown. If the
Q102: Refer to the graph shown. If the
Q103: When elasticities of supply and demand are
Q104: Refer to the graph shown. If the
Q105: Given the same supply elasticity, the
Unlock this Answer For Free Now!
View this answer and more for free by performing one of the following actions

Scan the QR code to install the App and get 2 free unlocks

Unlock quizzes for free by uploading documents