Refer to the following graph. 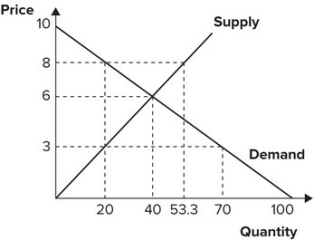 With an effective price ceiling at $3, the effect is an implicit tax on:
A) suppliers equal to $60.
B) suppliers equal to $80.
C) consumers equal to $60.
D) consumers equal to $80.
Correct Answer:
Verified
Q122: Refer to the graph shown. An effective
Q123: Refer to the graph shown. An effective
Q124: The price of gasoline is generally higher
Q125: Refer to the graph shown. With an
Q126: Refer to the graph shown. With an
Q128: Refer to the graph shown. With an
Q129: Refer to the graph shown. With an
Q130: Refer to the graph shown. An effective
Q131: Refer to the graph shown. With an
Q132: Refer to the graph shown. With an
Unlock this Answer For Free Now!
View this answer and more for free by performing one of the following actions

Scan the QR code to install the App and get 2 free unlocks

Unlock quizzes for free by uploading documents