Refer to the graph shown. When price rises from $30 to $40: 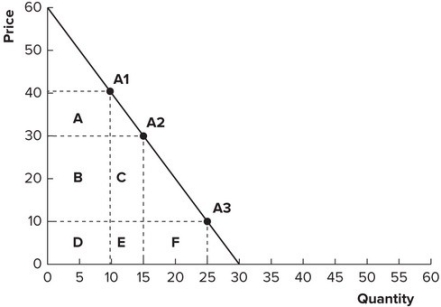
A) lost revenue is represented by areas C and E and gained revenue is represented by area A.
B) gained revenue is represented by areas C and E and lost revenue is represented by area A.
C) lost revenue is represented by areas B, C, D, and E and gained revenue is represented by area A.
D) gained revenue is represented by areas B, C, D, and E and lost revenue is represented by area A.
Correct Answer:
Verified
Q100: Refer to the graph shown. At which
Q101: Elasticity of demand for bus services is
Q102: GreenTree Corporation sells live Christmas trees. It
Q103: Compared to the elasticity of demand for
Q104: In Massachusetts, the price elasticity of license
Q106: The demand for a good is inelastic.
Q107: Suppose average attendance to Six Flags is
Q108: Refer to the graph shown. When price
Q109: During World War II, the price of
Q110: Refer to the following table to
Unlock this Answer For Free Now!
View this answer and more for free by performing one of the following actions

Scan the QR code to install the App and get 2 free unlocks

Unlock quizzes for free by uploading documents