Refer to the following graphs. 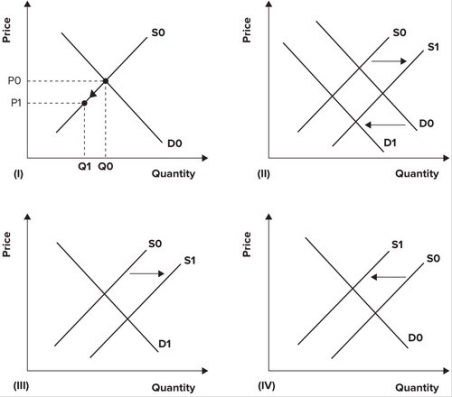 Floods in the U.S. Midwest reduce the U.S. corn crop. Which graph depicts the effect of the floods on the U.S. corn market?
A) I
B) II
C) III
D) IV
Correct Answer:
Verified
Q7: Suppose the price of tomatoes dramatically increases.
Q8: Suppose a recent and widely circulated medical
Q9: Given a downward sloping demand curve, a
Q10: The U.S. imposes substantial taxes on cigarettes
Q11: The U.S. Postal Service printed 150,000 sheets
Q13: Trade sanctions imposed on Iraq that limited
Q14: The Katrina disaster in New Orleans decreased
Q15: Online music stores such as Apple's iTunes
Q16: Real-world experience shows that when weather conditions
Q17: The effect of successful compliance with recycling
Unlock this Answer For Free Now!
View this answer and more for free by performing one of the following actions

Scan the QR code to install the App and get 2 free unlocks

Unlock quizzes for free by uploading documents