Refer to the following graph. 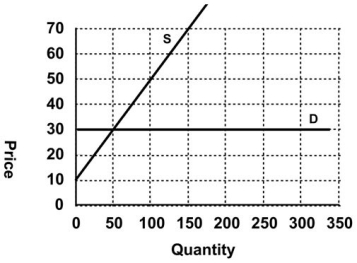 Which of the following pairs of equations describes the supply and demand curves?
A) Qs = 0.4P + 10; Qd =30 + P, respectively
B) Qs = 0.4P + 10; Qd =30, respectively
C) Qs = 2.5P − 25; P = 30 + P, respectively
D) Qs = 2.5P − 25; P = 30, respectively
Correct Answer:
Verified
Q112: Refer to the graph shown. If consumers
Q113: Suppose that the market labor supply and
Q114: Refer to the table shown that
Q115: Refer to the graph shown. If buyers
Q116: Suppose that a consumer has a health
Q118: Refer to the table shown that
Q119: Suppose that a consumer has a health
Q120: Which of the following pairs of
Q121: The Rent Control Authority of Chicago has
Q122: Given the equations for demand and supply:
Unlock this Answer For Free Now!
View this answer and more for free by performing one of the following actions

Scan the QR code to install the App and get 2 free unlocks

Unlock quizzes for free by uploading documents