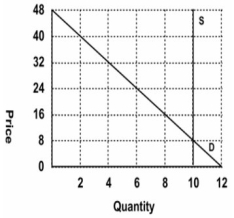
Refer to the following graph.  Which of the following pairs of equations describes the supply and demand curves?
A) Qs = 10; Qd = 12 − 0.25P, respectively
B) Qs = 10; Qd = 48 − 2P, respectively
C) Qs = P; Qd = 0.25P + 22, respectively
D) Cannot be determined
Correct Answer:
Verified
Q119: Suppose that a consumer has a health
Q120: Which of the following pairs of
Q121: The Rent Control Authority of Chicago has
Q122: Given the equations for demand and supply:
Q123: Consider a market for fish whose market
Q125: Consider a market for fish whose market
Q126: Suppose that initially, supply is given by
Q127: Suppose that the market labor supply and
Q128: Suppose that the free market labor supply
Q129: Consider a market for fish whose market
Unlock this Answer For Free Now!
View this answer and more for free by performing one of the following actions

Scan the QR code to install the App and get 2 free unlocks

Unlock quizzes for free by uploading documents