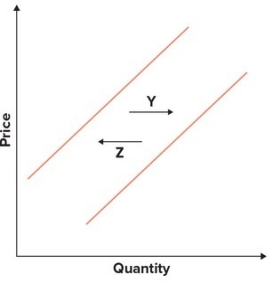
Assume the graphs shown reflect the egg market. The arrow that would best capture the impact of cheaper, prefabricated henhouses on the egg market is: 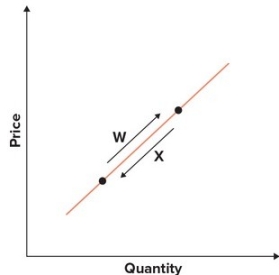
A) W.
B) X.
C) Y.
D) Z.
Correct Answer:
Verified
Q67: If the price of steel rises, the
Q68: The theory that quantity supplied and price
Q69: Suppose when you are offered $8.00 per
Q70: Suppose OPEC oil cartel announces that it
Q71: If Argentina imposes a 20 percent tax
Q73: The distinction between supply and the quantity
Q74: Refer to the graphs shown. The arrow
Q75: Refer to the graph showing the supply
Q76: Which of the following would not move
Q77: An upward-sloping supply curve implies that:
A) quantity
Unlock this Answer For Free Now!
View this answer and more for free by performing one of the following actions

Scan the QR code to install the App and get 2 free unlocks

Unlock quizzes for free by uploading documents