Refer to the graphs shown. The market is fat-free potato chips that contain the fat substitute olestra. Which graph best represents the impact of increased consumer concern about the effects of olestra on long-term health? 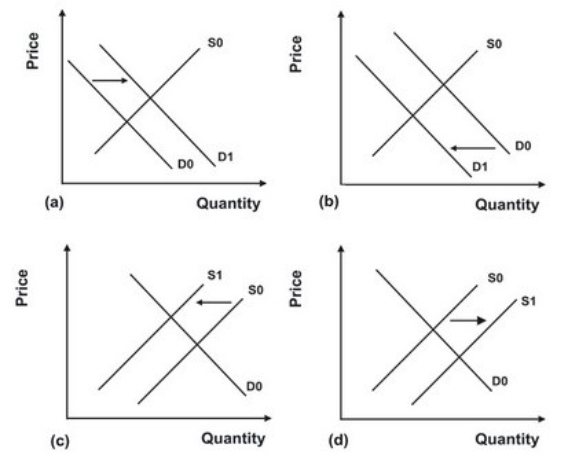
A) Graph a
B) Graph b
C) Graph c
D) Graph d
Correct Answer:
Verified
Q123: An increase in equilibrium price and a
Q124: The model of supply and demand leads
Q125: If supply and demand both shift to
Q126: A decrease in the number of consumers
Q127: When the drug Vioxx was pulled from
Q129: Refer to the graphs shown. The consequences
Q130: Refer to the graphs shown. The market
Q131: The model of supply and demand leads
Q132: Given that diesel cars get much better
Q133: Refer to the graphs shown. The market
Unlock this Answer For Free Now!
View this answer and more for free by performing one of the following actions

Scan the QR code to install the App and get 2 free unlocks

Unlock quizzes for free by uploading documents