The production possibility table below is for growing broccoli and asparagus in a 320-square-foot garden in one season. 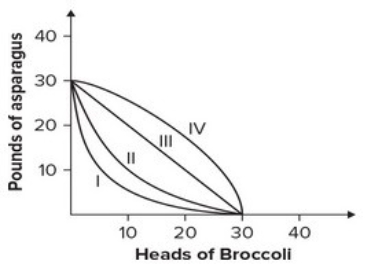 Which curve on the graph on the right corresponds to this table?
A) I
B) II
C) III
D) IV
Correct Answer:
Verified
Q1: Two nations with differing comparative advantages will
Q3: Refer to the graph below. 
Q4: Refer to the production possibility curve for
Q5: Investment in capital goods is one
Q6: If the principle of increasing marginal opportunity
Q7: The production possibility model can be used
Q8: The law of one price means that
Q9: Two nations with differing comparative advantages will
Q10: Which of the following cannot be determined
Q11: If a country has a comparative advantage
Unlock this Answer For Free Now!
View this answer and more for free by performing one of the following actions

Scan the QR code to install the App and get 2 free unlocks

Unlock quizzes for free by uploading documents